Anatomy of seating plans
Seatmap.pro is describing the anatomy of seating plans – the core consisting of three main data layers that are be used to render schemas.
Seatmap.pro breaks down the methods of seating plan rendering: HTML Tags, SVG, HTML Canvas and WebGL. Pros, cons and our own expert choices – everything to help in making the right choice.
The main goal of any ticketing system is to sell the tickets - this is a pretty obvious statement. However, building a JavaScript seating chart that performs well across devices and venue sizes is more complex than it looks. We will take a dive into the history of seating plan rendering to see how the systems progressed, break down the pros and cons of each approach, and evaluate the solutions that Seatmap.pro offers today.
In this article, we will review the approaches to rendering an interactive seating map from a technical standpoint, covering HTML, SVG, Canvas, and WebGL.
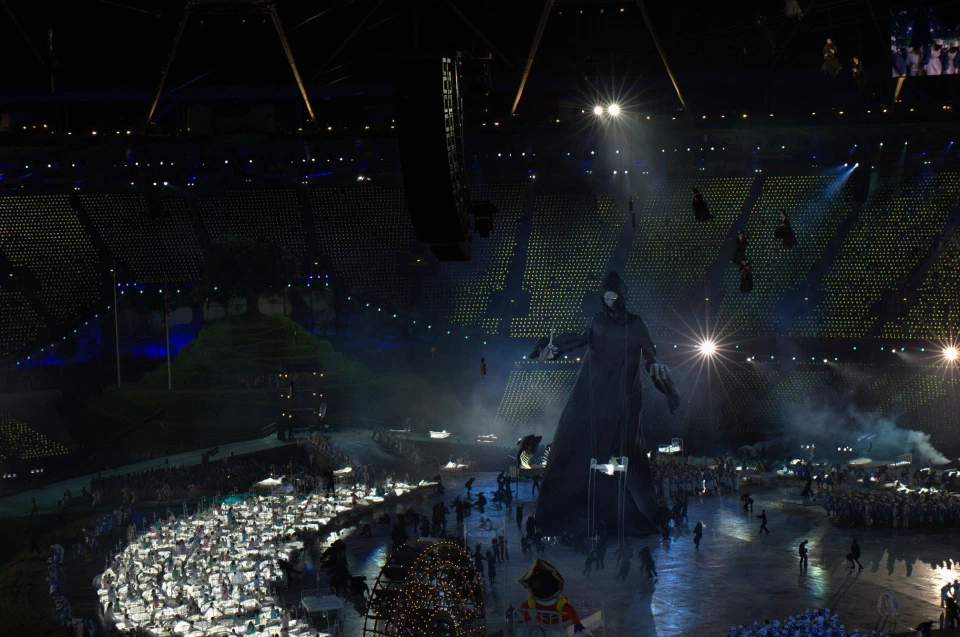
About ten years ago, a need to implement new rendering qualities in ticket sales appeared. This happened after offline; traditional ticket offices started going online. As the transition was happening, more challenges were emerging – both visual and UX. For instance, the first representatives of online ticketing systems were not able to reflect individual seats for bigger venues. The user needed to choose the section first, then zoom in on it and only after that the seats appeared. Despite the inconvenience and lack of visual appeal, his approach can still be found out there.
The way seating plans look and function depend on the way developers decide to render. In essence, this is precisely what we are going to discuss. There are three main ways from which one can choose how to render – we will go through them all in detail further. It can also be said that the following paragraphs will take you on an overview excursion of how rendering has been developing.
Let’s start with taking a couple of steps back in time. Back in the day, when the seating plans were not as elaborate as the ones we are working on now, all the providers were using pure HTML to render. Now, in 2020, it’s amazing to see HTML still being around. There is, of course, a reason for this:
Besides the apparent pros (and HTML Tags being the first applied method of rendering seating plans), there are quite some cons. When it comes to rendering seating plans, the concept of HTML rendering is now quite outdated, and this is for a reason. The problems lie in several dimensions at once:
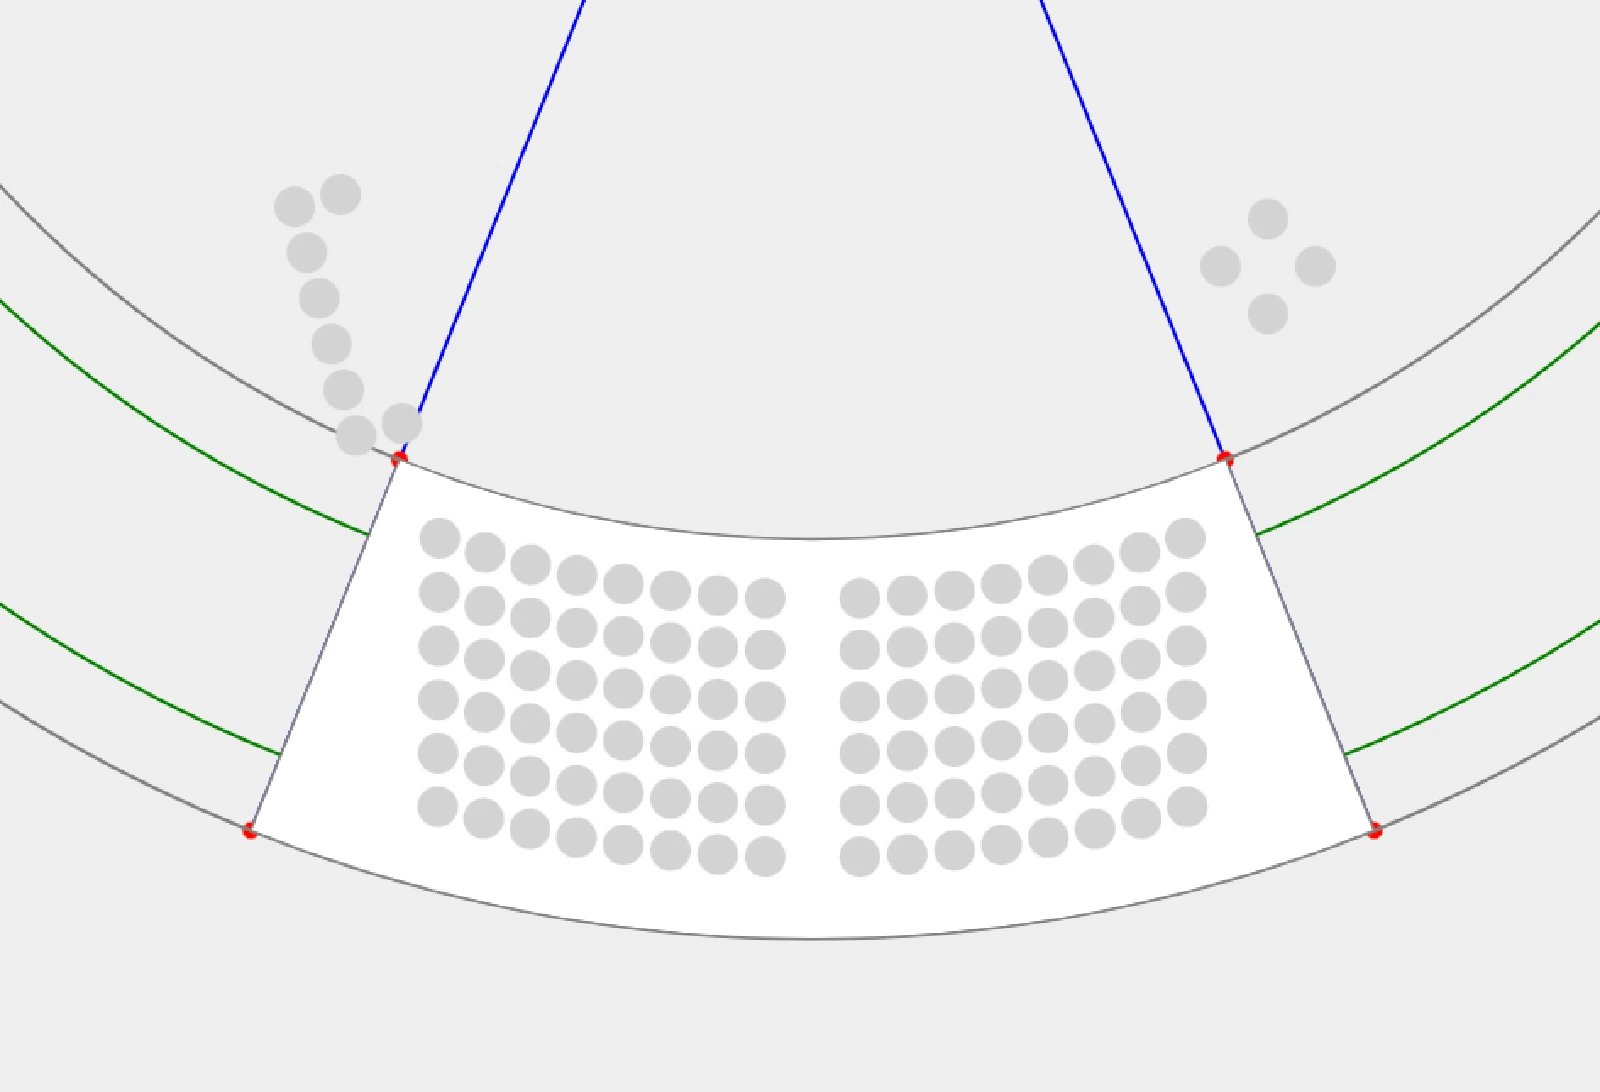
Scalable Vector Graphics, better known as SVG, is a vector graphic format based on XML. Points, lines, curved lines and polygons are used to create images. When using SVG, it is possible to create images that do not lose quality when being scaled. SVG is also described as “retained-mode” graphic models, as the events and objects become part of the DOM (Document Object Model) tree.
Compared to the previous versions, seating plans rendered with the use of SVG had significant advantages. Generally speaking, using this method gave more freedom to the developers and came with perks such as:
SVGs are great for rendering the plans of smaller venues. However, there might be difficulties when trying to squeeze objects in. The most significant down point of SVG is derived from this fact:
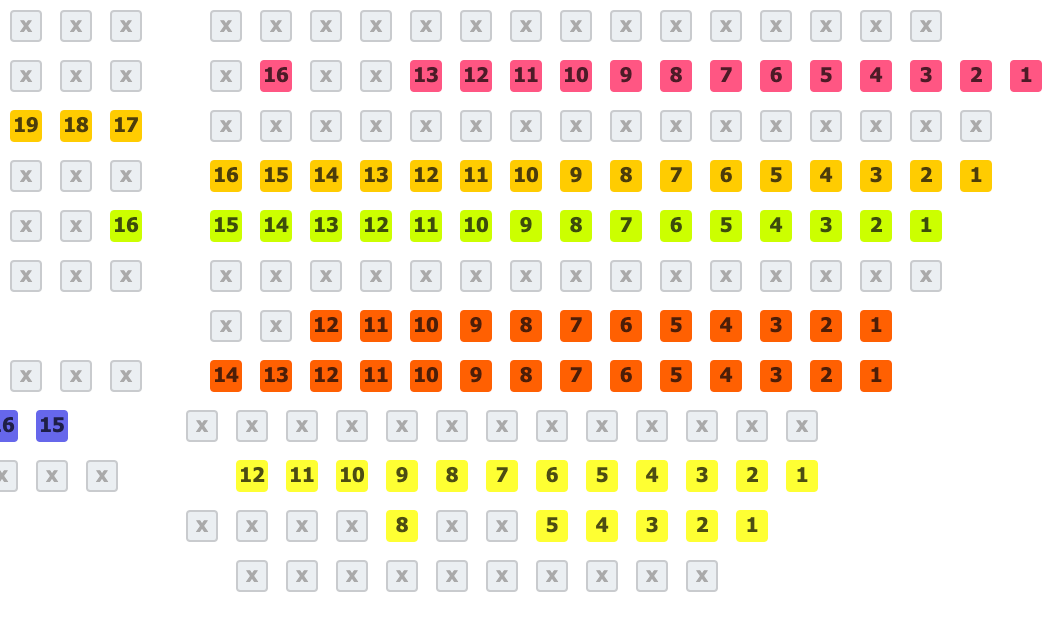
Using Canvas in rendering seating plans came around considerably later, so this method is quite more developed than the previous two. Here are some perks that come with using HTML Canvas for a seating chart:
When it comes to disadvantages, the main one is the lack of built-in accessibility. Since Canvas draws pixels rather than DOM elements, screen readers cannot traverse individual seats without additional ARIA markup or a fallback accessible view.
In case there is a need to use something more elaborate, on the level of cutting-edge technology, you could consider going for WebGL. WebGL is a JavaScript API used for rendering interactive 2D and 3D graphics with any browser compatible and without the use of plugins.
As a more modern and, overall, developed approach, WebGL has advantages such as:
However, just like with the options we have mentioned before, WebGL also comes with some downsides:
After years of building seating plan renderers, the Seatmap.pro team has tested every approach described above in production. Here is our practical guidance for choosing the right rendering technology:
Skip HTML Tags. They are outdated for interactive seating maps. The DOM overhead and limited visual capabilities make them unsuitable for any modern ticketing system.
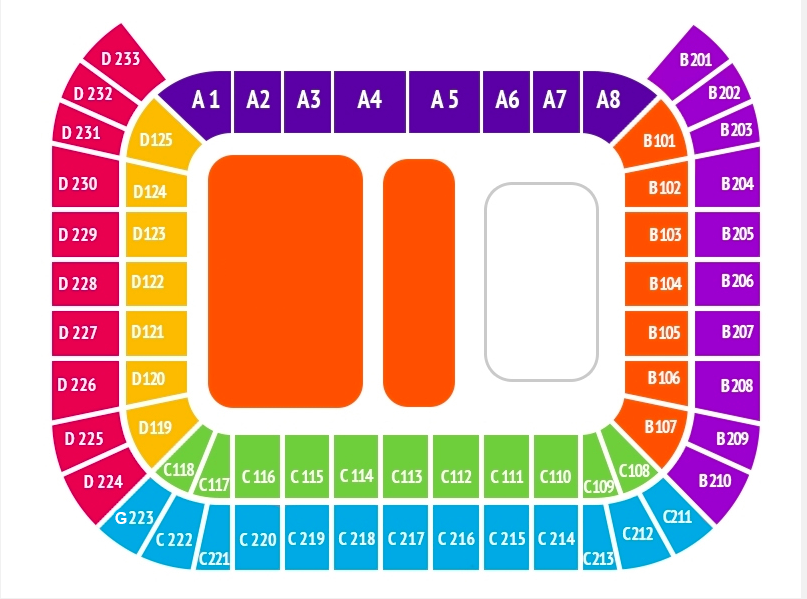
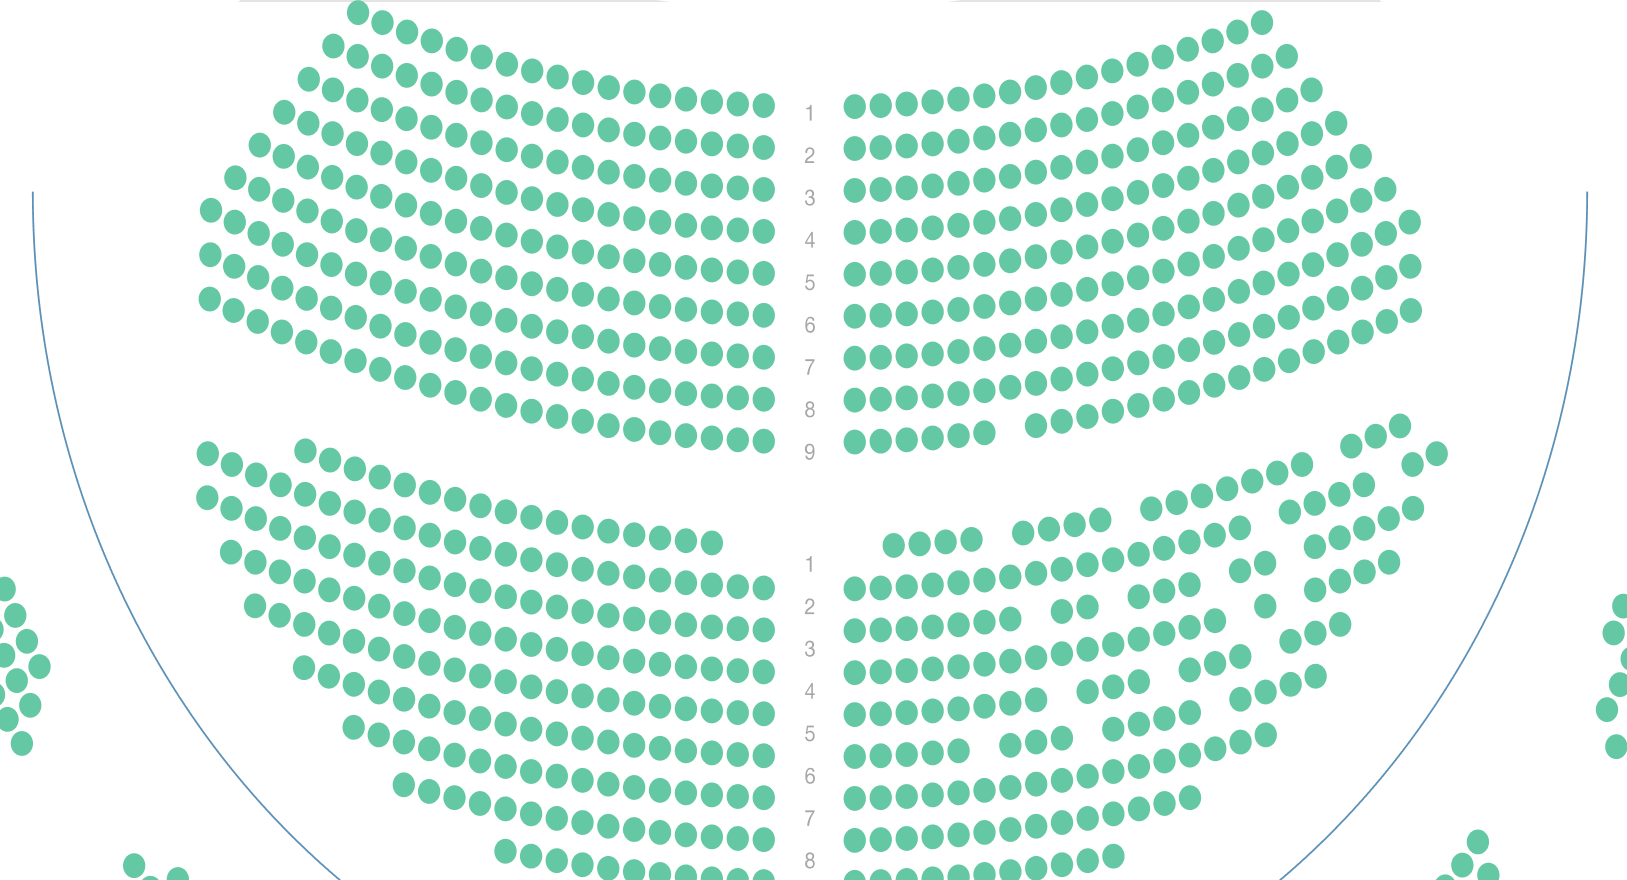
Use SVG for small venues (under 1,000 seats). SVG works well for theaters, conference rooms, and small arenas. Each seat is a DOM element, which means built-in click handling, CSS styling, and accessibility. You also get SVG export for printing. Seatmap.pro’s editor uses SVG for venue schema creation and export.
Use Canvas for mid-to-large venues (1,000–50,000 seats). This is the sweet spot for most JavaScript seating chart implementations. Canvas handles thousands of interactive objects without performance degradation, supports smooth pan/zoom, and renders at 60fps on modern devices. If you are building a ticketing system for stadiums, concert halls, or multi-section arenas, Canvas is the right choice. Seatmap.pro’s booking renderer uses Canvas with WebGL acceleration for exactly this reason.
Use WebGL for extreme scale (50,000+ seats or 3D). WebGL gives you GPU-accelerated rendering for the largest venues and 3D visualization. The development complexity is significantly higher, but the performance ceiling is unmatched. Seatmap.pro leverages WebGL under the hood to render interactive seating maps with hundreds of thousands of objects while keeping power consumption low on mobile devices.
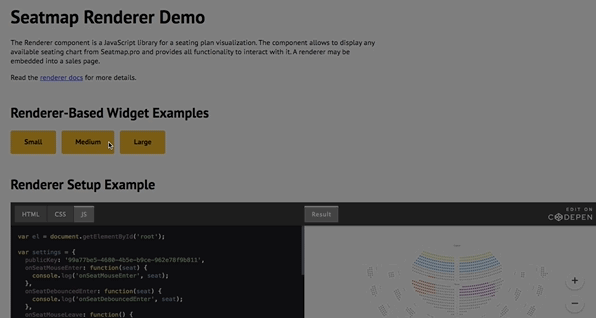
Rather than building a seating chart renderer from scratch, you can integrate Seatmap.pro’s JavaScript SDK into your ticketing platform. The renderer handles Canvas/WebGL rendering, seat selection, real-time availability, and responsive layout out of the box. See the Playground to test it live, or read the SDK documentation to get started.
If you are weighing us against another vendor, Seatmap Pro vs Seats.io compares rendering tech, pricing, and deployment head-to-head, and Seats.io alternatives for 2026 covers the broader competitor landscape.
Seatmap.pro is describing the anatomy of seating plans – the core consisting of three main data layers that are be used to render schemas.
Seatmap.pro team has struggled with the common problem of those developing ticketing systems. Having found the solution, we are presenting GoS – the seating data storage model allowing to form a new, convenient industry standard.
Seatmap.pro team is offering help in fighting the COVID-19 pandemic to the medical projects. Data visualization, developing visual editors, creating simulation systems and more for the good of all humankind.